
Key Takeaways
- Quality scores 32/100, but Yahoo’s 58.5% gross margin conflicts with reported gross profit of $766,000 on $15.1 million of second-quarter revenue, and the trailing net margin is -182.2%.
- Growth scores 74/100 on 144.6% second-quarter revenue growth, which falls to 73% excluding an accounting change, while annual revenue was roughly flat from 2022 to 2025.
- Opportunity scores 29/100 with the shares at $0.90, in the lower end of their two-year range, after the share count rose from about 103 million at the end of 2025 to 244.6 million in August.
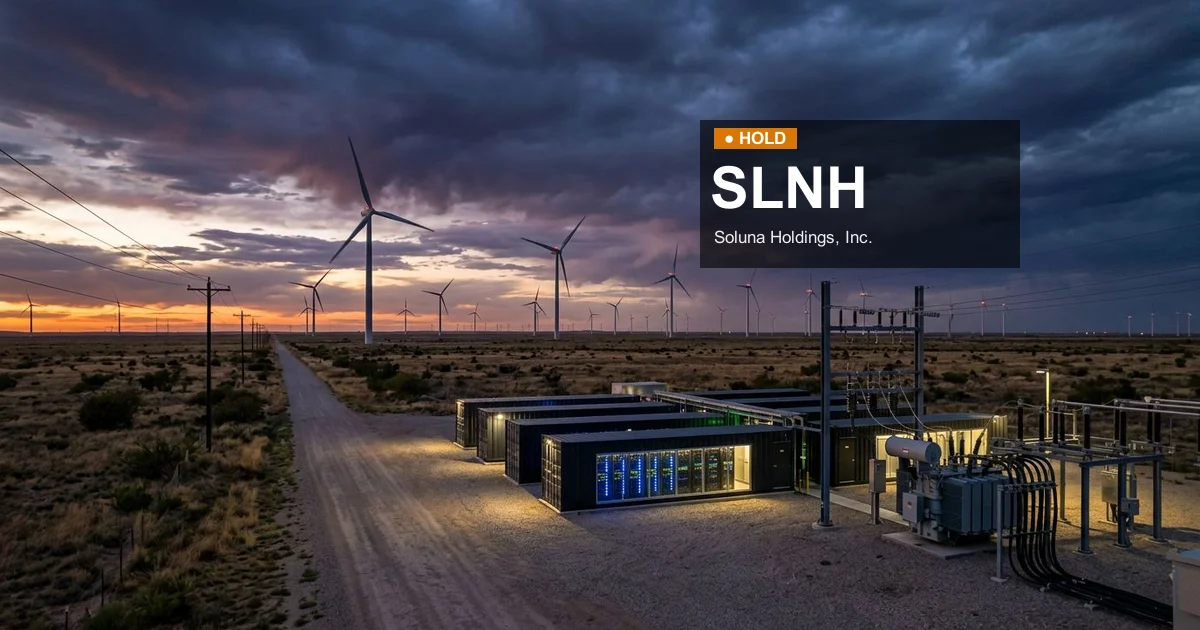
Soluna Holdings, which develops renewable-powered data centers in Texas for bitcoin mining and artificial-intelligence computing, closed at $0.90 on Friday, October 9, its second straight close below $1. This is a speculative, loss-making micro-cap: it lost about $77 million over the past four quarters on $42 million of revenue, and it has funded its expansion largely by selling shares, lifting its share count from about 103 million at the end of 2025 to 244.6 million by August 10. This Soluna Holdings stock analysis, based on Yahoo Finance data as of October 11, 2026 and our first on the company, explains why the scoring model rates it a Hold, and why corrected data would point to a Sell.
What Is Happening With the Stock Price
At $0.90, Soluna sits in the lower end of its two-year range of $0.41 to $4.42 on weekly closes, about 80% below the high. On daily closes the range runs from $0.40 in April 2025 to $4.52 in October 2024. The shares fell 5.9% on Thursday and 5.3% on Friday and are down 23.1% this year from $1.17. We found no company announcement tied to the latest drop; the most recent news was a September 28 expansion of Bitdeer’s planned deployment at the Project Kati 1 site to 35 megawatts. If the shares close below $1 for 30 consecutive business days, Nasdaq’s minimum bid price rule would trigger a deficiency notice. The company last carried out a 1-for-25 reverse stock split in October 2023.
Quality: Is This a Financially Sound Business?
Quality scores 32/100. Yahoo reports a 58.5% gross margin, but that figure does not match the company’s results: gross profit was $766,000 on $15.1 million of second-quarter revenue, about 5%, and Yahoo’s own quarterly data show about $6.8 million of gross profit on $42.1 million of revenue over four quarters, roughly 16%. The -112.0% operating margin is the second-quarter figure, and the trailing net margin is -182.2%. Return on equity is -68.4% and return on assets -17.3%. Yahoo’s free cash flow figure of -$40 million gives a yield of -18.2%; its quarterly cash flow data show an outflow of about $57 million over four quarters once capital spending is included.
The balance sheet is the strongest part of this Soluna Holdings stock analysis, thanks to recent share sales. Cash was $113.4 million at June 30 against debt of $39.3 million on Yahoo’s figures, a debt-to-equity ratio of 0.19, with a current ratio of 2.06 and a quick ratio of 1.83. In the second quarter alone the company raised $159.4 million, including $113.5 million from at-the-market share sales, and it sold another 18.8 million shares for $23.6 million after the quarter ended.
Growth: Does This Company Have Real Upside?
Growth scores 74/100, but two of its inputs are unreliable. Yahoo’s 144.6% revenue growth figure compares the second quarter with the same quarter of 2025, when revenue was $6.2 million. From the second quarter, Soluna began reporting pass-through electricity costs on a gross basis, adding about $4.4 million to both revenue and costs; excluding that change, the company put growth at 73%. The 53.9% compound growth rate Yahoo labels as five-year is not meaningful: Yahoo’s income statement history for Soluna pairs 2025 revenue with entries from 2006 and 2007 and a zero for 2024, so the calculation compares 2025 with 2006. Yahoo’s annual series shows revenue of $28.5 million in 2022, $21.1 million in 2023, $38.0 million in 2024 and $29.7 million in 2025, roughly flat over three years.
The development pipeline is large, about 6.3 gigawatts against 192 megawatts in operation as of August, but building it out would take far more capital than the company has. Soluna’s own illustrative case puts the cost of a 100-megawatt AI campus at $1.2 billion to $1.3 billion, which management stressed was not a forecast. EV/Revenue is 4.77.
Opportunity: Is Now a Good Time to Enter?
Opportunity scores 29/100. With no P/E (trailing EPS is -$0.64) and a negative EV/EBITDA of -5.82, the valuation rests on the -18.2% free cash flow yield and a price-to-book ratio of 1.29, close to book value, though much of that equity was raised through share sales. The low position in the two-year range earns no credit, because the model only rewards beaten-down prices when Quality is at least 40. The main risks are further dilution, continued cash burn, financing needs far larger than the $0.22 billion market value, the Nasdaq listing rule, and the lack of a definitive tenant lease for the Kati 2 AI project as of the second-quarter update. The upside case depends on turning the pipeline into contracted, profitable capacity.
Soluna Holdings Stock Analysis: The Bottom Line
Our Soluna Holdings stock analysis finds a fast-growing but deeply unprofitable developer whose expansion has been financed by heavy dilution. Quality is 32/100, Growth 74/100 and Opportunity 29/100, for a recommendation score of 45/100 and a Hold signal. That Hold depends on Yahoo figures that look wrong. Using the gross margin implied by reported gross profit, Quality falls to about 24, below the level at which the model issues an automatic Sell, and with the growth and cash flow figures also corrected, the recommendation score drops to about 32, which would also be a Sell. The bull case is $113.4 million of cash, a large power pipeline and growing hosting revenue; the bear case is a -182.2% net margin, a share count that has more than doubled this year and a share price below $1. Third-quarter results, which Yahoo lists for November 12, will update the picture. Buy / Hold / Sell reflects StreetBriefs’ quantitative scoring model (Quality, Growth, Opportunity), a data-driven signal for further research, not a personalized recommendation to transact.
Financial Metrics Summary
| Metric | Value |
|---|---|
| Price & Valuation | |
| Current Price | $0.90 |
| 2-Year Low | $0.41 |
| 2-Year High | $4.42 |
| Market Cap | $0.22B |
| EV / Revenue | 4.77 |
| Our Scores | |
| Quality Score | 32 / 100 |
| Growth Score | 74 / 100 |
| Opportunity Score | 29 / 100 |
| Profitability | |
| Earnings Per Share | -$0.64 |
| Return on Assets | -17.3% |
| Return on Equity | -68.4% |
| Net Profit Margin | -182.2% |
| Gross Margin | 58.5% |
| Operating Margin | -112.0% |
| Growth | |
| Revenue Growth (5Y CAGR) | 53.9% |
| Revenue Growth (TTM) | 144.6% |
| Balance Sheet | |
| Debt-to-Equity | 0.19 |
| Current Ratio | 2.06 |
| Quick Ratio | 1.83 |
| Income & Dividends | |
| Dividend Yield | 0.0% |
| Payout Ratio | 0.0% |
Data as of October 11, 2026
Our Three-Pillar Assessment
| Quality |
32/100 |
| Growth |
74/100 |
| Opportunity |
29/100 |
Quality measures business fundamentals: profitability, cash flow discipline, and balance sheet strength.
Growth captures revenue momentum, gross margin scalability, and the Rule of 40 efficiency test.
Opportunity signals entry timing: current valuation versus history and price position in the 2-year range.
Current price: $0.90 trading 80% below its 2-year high of $4.42 on weekly closes.
Keep researching SLNH
Follow SLNH’s scores in Qubits Finance
The Quality, Growth and Opportunity scores above come from the same model that powers the Qubits Finance screener. Compare SLNH with its peers, keep it on a watchlist, and see when its scores change. There, the model’s Buy, Hold and Sell signals read Positive, Neutral and Caution.
See SLNH in the screener →What Qubits Finance offers
The screener is on the free plan; accounts are approved by a person during the private beta. Research tools and information only: Qubits Finance does not place trades or make personal recommendations. Want a stock we have not covered? Request an analysis.
This analysis is done using financial data from Yahoo Finance.
Always conduct your own due diligence and consult a qualified financial advisor before making investment decisions.
