
Key Takeaways
- Quality (54/100): GAAP margins are depressed by deal costs – a 12.9% operating margin versus a 20.2% adjusted margin in the second quarter – and liquidity is thin, with a 0.48 current ratio and 1.00 debt-to-equity.
- Growth (80/100): reported revenue growth of 75.6% is mostly the JDE Peet’s acquisition; the legacy business grew 7.3% in constant currency, and on that basis we estimate Growth would be about 49/100.
- Opportunity (69/100): an 11.2% free-cash-flow yield (likely overstated – the second quarter’s pace implies roughly 7%), a 1.65 price-to-book and a mid-range share price support the Buy signal despite a 30.68 GAAP P/E.
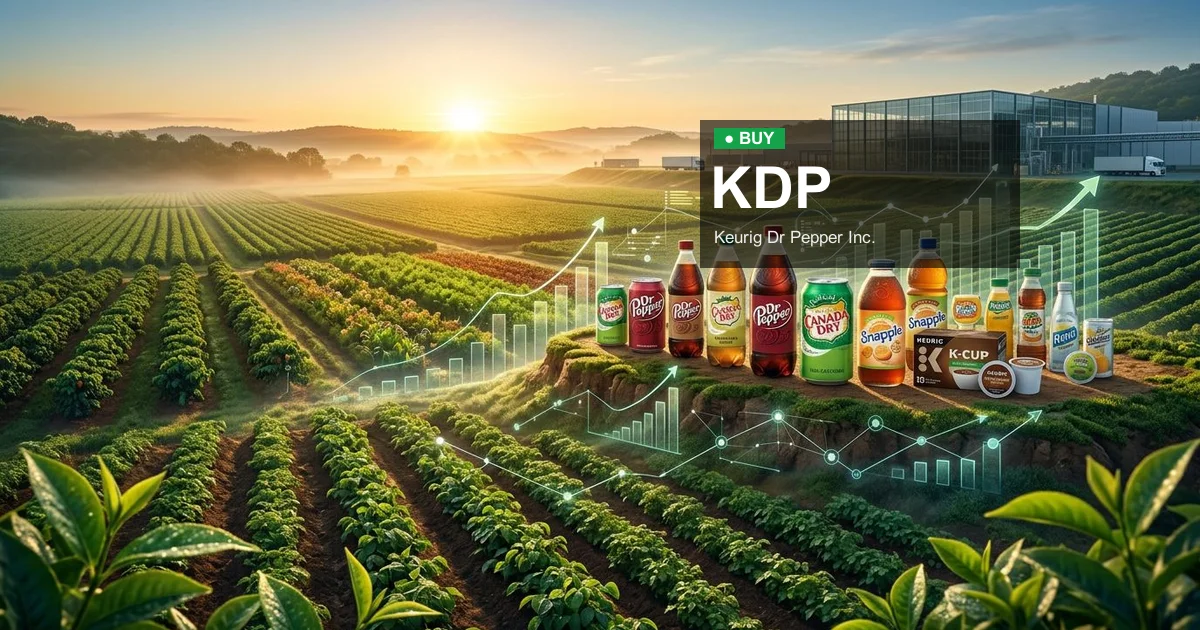
Keurig Dr Pepper, the company behind Dr Pepper, Canada Dry and the Keurig coffee system, now also owns Amsterdam-based coffee group JDE Peet’s – a deal completed on April 1, 2026 that has reshaped almost every number in its financial profile. At $30.37, the shares trade in the middle of their two-year range, and the scoring model rates them a Buy on a Recommendation Score of 68/100. This Keurig Dr Pepper stock analysis, based on Yahoo Finance data as of October 3, 2026, explains why that signal leans heavily on acquisition-driven growth, and what the underlying business looks like without it.
What Is Happening With the Stock Price
At $30.37, the shares sit in the middle of their two-year range of $25.31 to $36.94, about 20% above the low and 18% below the high. The stock slipped about 1% on Friday. Attention is focused on integrating JDE Peet’s and on the planned separation into two U.S.-listed companies – a cold-beverage business and a global coffee company – which management has said it is preparing for in early 2027. Second-quarter results, the first to include JDE Peet’s, came in ahead of analysts’ forecasts, according to published reports, and management reaffirmed its 2026 outlook for $25.9 billion to $26.4 billion in net sales and low-double-digit growth in adjusted EPS.
Quality: Is This a Financially Sound Business?
Quality scores 54/100, held down by profit figures that are depressed by deal costs. Gross margin is 51.0%, but the operating margin is only 12.9% and the net profit margin 7.1%, with return on equity of 5.1% and return on assets of 3.4%. These GAAP figures include large acquisition-related items: in the second quarter alone, KDP recorded a $314 million inventory step-up and $318 million of JDE Peet’s acquisition, integration and financing costs, and its adjusted operating margin was 20.2%. The balance sheet is the bigger constraint in this Keurig Dr Pepper stock analysis. Debt-to-equity is 1.00, the current ratio is 0.48 and the quick ratio just 0.20, and management is working to bring its pro-forma leverage ratio down to about 4.1 times by the end of 2026.
Growth: Does This Company Have Real Upside?
Growth scores 80/100 – and this is where the headline numbers need the most context. Yahoo’s revenue growth figure of 75.6% matches the year-over-year increase KDP reported for the second quarter, but most of that came from adding JDE Peet’s, which contributed about $2.8 billion of the quarter’s $7.31 billion in net sales. The legacy business grew 7.3% in constant currency, on 4.2% net price realization and 3.1% volume/mix growth – closer to the 5.7% five-year revenue CAGR. Earnings growth of -90.0% matches the drop in second-quarter GAAP EPS to $0.04, while adjusted EPS rose 16.3% to $0.57. The model takes the reported 75.6% at face value; if the 7.3% legacy growth rate were used instead, we estimate the Growth score would fall to roughly 49/100. The EV/Revenue multiple of 4.08 is moderate for a branded beverage business.
Opportunity: Is Now a Good Time to Enter?
Opportunity scores 69/100, the strongest pillar. On GAAP earnings the P/E of 30.68 looks full, but those earnings are depressed by deal costs; EV/EBITDA of 17.05 and price-to-book of 1.65 give a more moderate picture. The biggest contributor is a free-cash-flow yield of 11.2%, based on $4.6 billion of trailing free cash flow. That figure looks high next to the $714 million of free cash flow KDP reported for the second quarter – an annualized pace of about $2.9 billion, or roughly a 7% yield – so the trailing number should be treated with caution, though even a 7% yield would still score well in the model. The dividend yields 3.0%, but a payout ratio of 92.9% of GAAP earnings leaves limited room while the company is paying down debt. With the shares mid-range, the model treats the price position as neutral to mildly favorable.
Keurig Dr Pepper Stock Analysis: The Bottom Line
This Keurig Dr Pepper stock analysis ends with a model signal of Buy and a Recommendation Score of 68/100, combining Quality 54/100, Growth 80/100 and Opportunity 69/100. That signal leans on the acquisition: if the model used the legacy business’s 7.3% growth in place of the reported 75.6%, we estimate the Recommendation Score would fall to about 57/100, below the 60 threshold for a Buy, and the signal would be Hold. The bull case: a portfolio of established beverage and coffee brands, legacy sales growth of 7.3%, rising adjusted earnings, solid cash generation and a 3.0% dividend yield, with a planned separation that could sharpen each business’s focus. The bear case: heavy debt and thin liquidity after a large acquisition, GAAP earnings down 90.0% on deal costs, a high payout ratio, integration and separation execution risk, and coffee commodity costs that can squeeze margins. If integration stumbles or deleveraging stalls, the debt load could weigh on the shares.
The Buy label reflects StreetBriefs’ quantitative scoring model (Quality, Growth, Opportunity) – a data-driven signal for further research, not a personalized recommendation to transact.
Financial Metrics Summary
| Metric | Value |
|---|---|
| Price & Valuation | |
| Current Price | $30.37 |
| 2-Year Low | $25.31 |
| 2-Year High | $36.94 |
| Market Cap | $41.33B |
| P/E Ratio | 30.68 |
| EV / Revenue | 4.08 |
| Our Scores | |
| Quality Score | 54 / 100 |
| Growth Score | 80 / 100 |
| Opportunity Score | 69 / 100 |
| Profitability | |
| Earnings Per Share | $0.99 |
| Return on Assets | 3.4% |
| Return on Equity | 5.1% |
| Net Profit Margin | 7.1% |
| Gross Margin | 51.0% |
| Operating Margin | 12.9% |
| Growth | |
| Revenue Growth (5Y CAGR) | 5.7% |
| Revenue Growth (TTM) | 75.6% |
| Earnings Growth (TTM) | -90.0% |
| Balance Sheet | |
| Debt-to-Equity | 1.00 |
| Current Ratio | 0.48 |
| Quick Ratio | 0.20 |
| Income & Dividends | |
| Dividend Yield | 3.0% |
| Payout Ratio | 92.9% |
Data as of October 03, 2026
Our Three-Pillar Assessment
| Quality |
54/100 |
| Growth |
80/100 |
| Opportunity |
69/100 |
Quality measures business fundamentals: profitability, cash flow discipline, and balance sheet strength.
Growth captures revenue momentum, gross margin scalability, and the Rule of 40 efficiency test.
Opportunity signals entry timing: current valuation versus history and price position in the 2-year range.
Current price: $30.37 trading 18% below its 2-year high of $36.94.
This analysis is done using financial data from Yahoo Finance.
Always conduct your own due diligence and consult a qualified financial advisor before making investment decisions.
